Web Vitals Explained: How LCP, CLS, and INP Are Actually Measured (Before You Optimize Anything)

Core Web Vitals: How LCP, CLS & INP Are Really Measured
Short Description: Master Core Web Vitals by learning how LCP, CLS, and INP are measured before you optimize — so every fix targets the right problem.
Keywords: Core Web Vitals, LCP, CLS, INP, Largest Contentful Paint, Cumulative Layout Shift, Interaction to Next Paint, web performance metrics, how LCP is measured, how CLS is calculated, INP explained, PageSpeed Insights, Lighthouse score, CrUX data, field data vs lab data, web performance optimization, JavaScript performance, rendering performance, Google ranking signals
Performance optimization is one of those disciplines where developers love to jump straight to solutions. Add loading="lazy". Compress images. Split the bundle. Remove render-blocking scripts. These are all valid moves — but they're also shots in the dark if you don't first understand how the browser is actually measuring the metrics you're trying to improve.
Google's Core Web Vitals — LCP, CLS, and INP — are not abstract benchmarks. They are precisely defined, carefully timed, and measured with specific rules that frequently surprise even experienced developers. Misunderstanding the measurement model means your optimizations might not move the needle at all, or worse, improve a lab score while leaving real users with the same experience.
This post is about the measurement model first. Optimization second.
Why Measurement Comes Before Optimization
Here's a scenario that happens constantly: a developer sees a poor LCP score in PageSpeed Insights, compresses their hero image, re-tests, and sees no meaningful change. Why? Because the LCP element wasn't the hero image — it was a <h1> text node that was blocked by a render-blocking stylesheet.
Or they fight a CLS score for hours, only to discover the shift isn't happening on page load at all — it's triggered by a late-loading cookie banner, which doesn't show up in their lab tests.
The point: you cannot fix what you haven't precisely located. Each Web Vital has a measurement definition, a timing window, and edge cases. Understanding these is not optional — it's the foundation.
LCP — Largest Contentful Paint
What It Measures
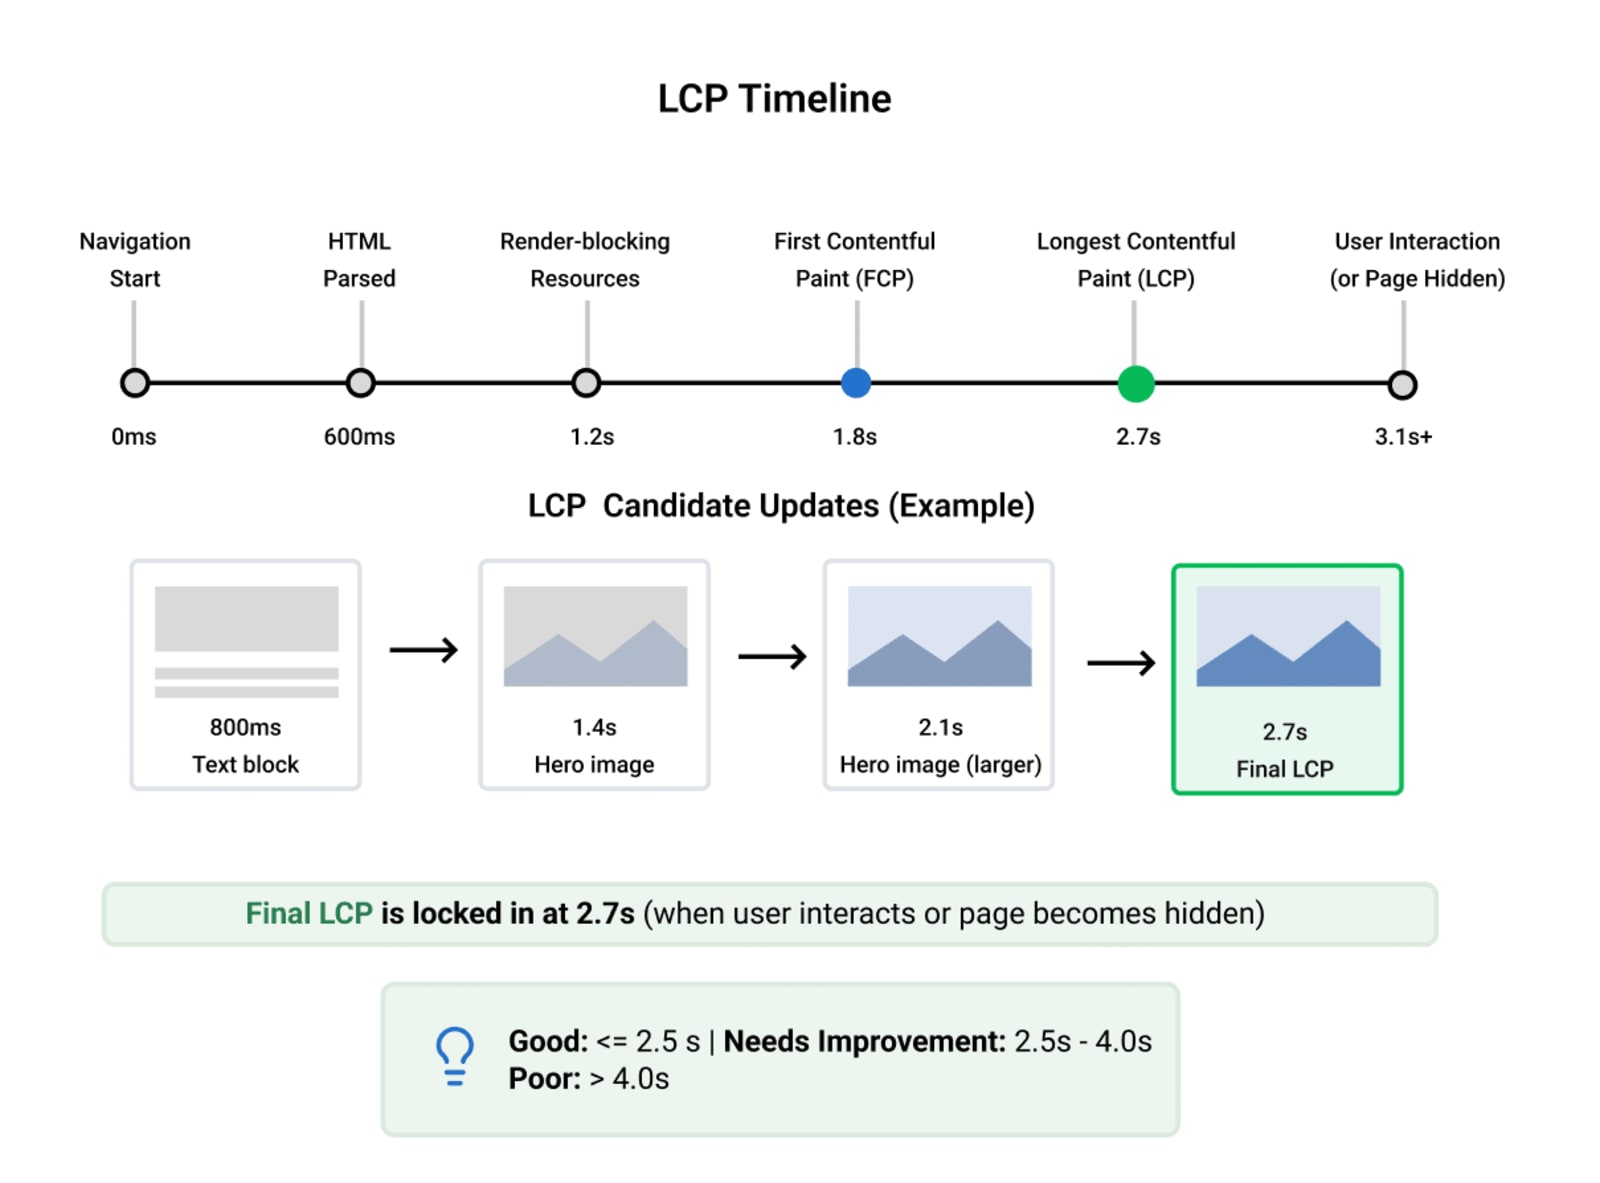
LCP measures the render time of the largest image or text block visible in the viewport, relative to the time the page first started loading. It's a proxy for "when does the user feel like the page is there?"
The element types considered for LCP are:
<img>elements<image>inside SVG<video>elements (poster image)Elements with a CSS
background-imageloaded viaurl()Block-level elements containing text nodes
Inline SVGs and <canvas> elements are not candidates.
When Is It Captured?
The browser continuously emits LCP candidate entries as the page loads. Each time a larger contentful element becomes visible, it replaces the previous candidate. The final LCP value is locked in when the user first interacts with the page (click, keypress, scroll) or when the page's lifecycle transitions to hidden.
This has an important implication: if nothing large appears until 4 seconds in, your LCP is 4 seconds — even if everything else painted instantly.
What Counts Against You
A remote font that blocks text rendering (
font-display: blockor missingfont-display)A hero image that isn't preloaded and sits behind 2–3 render-blocking resources
Server-side HTML that's delayed by slow TTFB (Time to First Byte)
Client-side rendering where the LCP element is injected via JavaScript after the main thread is free
Scoring Thresholds
Score | LCP |
|---|---|
Good | ≤ 2.5s |
Needs Improvement | 2.5s – 4.0s |
Poor | > 4.0s |
The threshold is measured at the 75th percentile of real user sessions in the Chrome User Experience Report (CrUX). This means your target isn't "fastest possible" — it's "fast for at least 75% of your visitors."
CLS — Cumulative Layout Shift
What It Measures
CLS measures visual instability — how much the page's content unexpectedly jumps around during the user's session. Every time an element shifts position without a user interaction triggering it, that contributes to the CLS score.
The score is not a time measurement. It's a unitless score calculated from layout shift events using this formula:
Layout Shift Score = Impact Fraction × Distance Fraction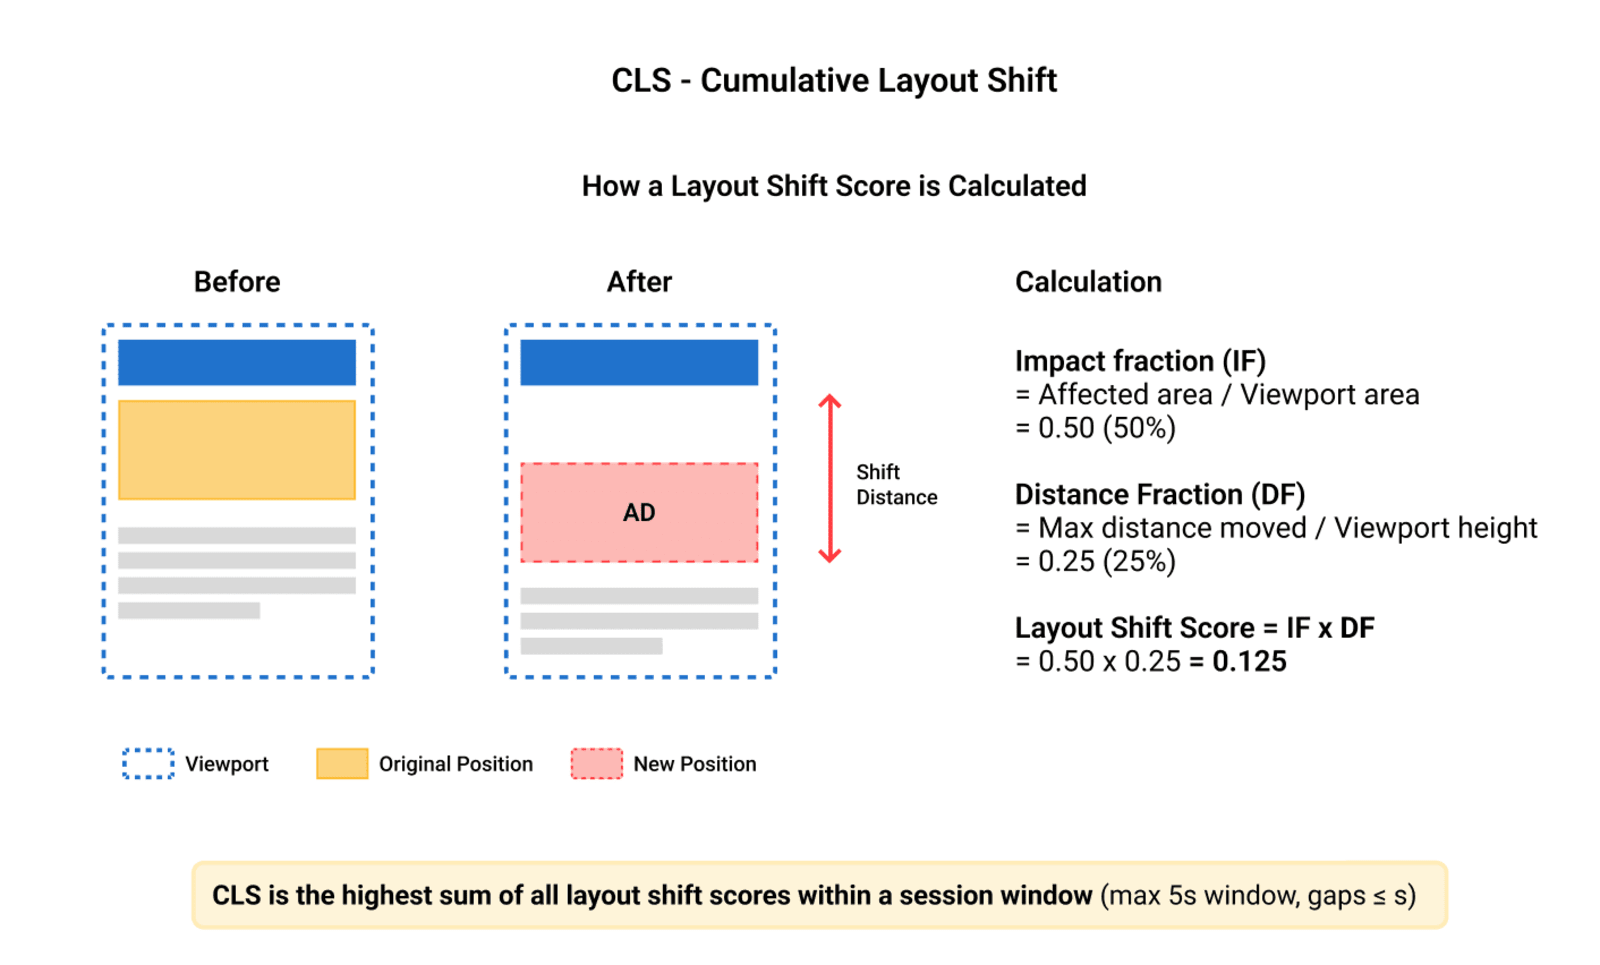
Impact Fraction: The combined area of the viewport affected by the shift (before + after positions), as a percentage of total viewport area.
Distance Fraction: The maximum distance any shifted element moved, as a fraction of the viewport's largest dimension.
So if an element occupies 50% of the viewport and shifts 25% of the viewport height, the layout shift score for that event is 0.50 × 0.25 = 0.125.
Session Windows and the Cumulative Model
CLS originally summed all layout shifts across the page lifetime, which made long-lived pages (news sites, SPAs) unfairly penalized. Google updated the spec in 2021 to use session windows.
A session window is a group of layout shifts where no individual shift is more than 1 second apart and the total window duration is no more than 5 seconds. The CLS score is the maximum session window value across the entire page session.
This matters because it means: a single burst of three shifts is one session window. Three isolated shifts separated by 2-second gaps are three separate windows, and only the largest counts.
What Doesn't Count as a Shift
The browser is smart enough to exclude user-initiated layout shifts. If a user clicks a "Read More" button and the content expands, that does not count. The exclusion window is 500ms after the last user input.
What does count:
Images without explicit
widthandheightattributes (browser reserves no space, then reflows when image loads)Ads, embeds, or iframes that expand after the initial render
Dynamically injected content above existing content
Fonts causing FOUT (Flash of Unstyled Text) that changes line heights
Scoring Thresholds
Score | CLS |
|---|---|
Good | ≤ 0.1 |
Needs Improvement | 0.1 – 0.25 |
Poor | > 0.25 |
INP — Interaction to Next Paint
What It Measures
INP replaced FID (First Input Delay) in March 2024 as a Core Web Vital. While FID only measured the delay before the browser starts handling an event, INP measures the full duration of an interaction — from the moment the user interacts to the next frame that the browser paints in response.
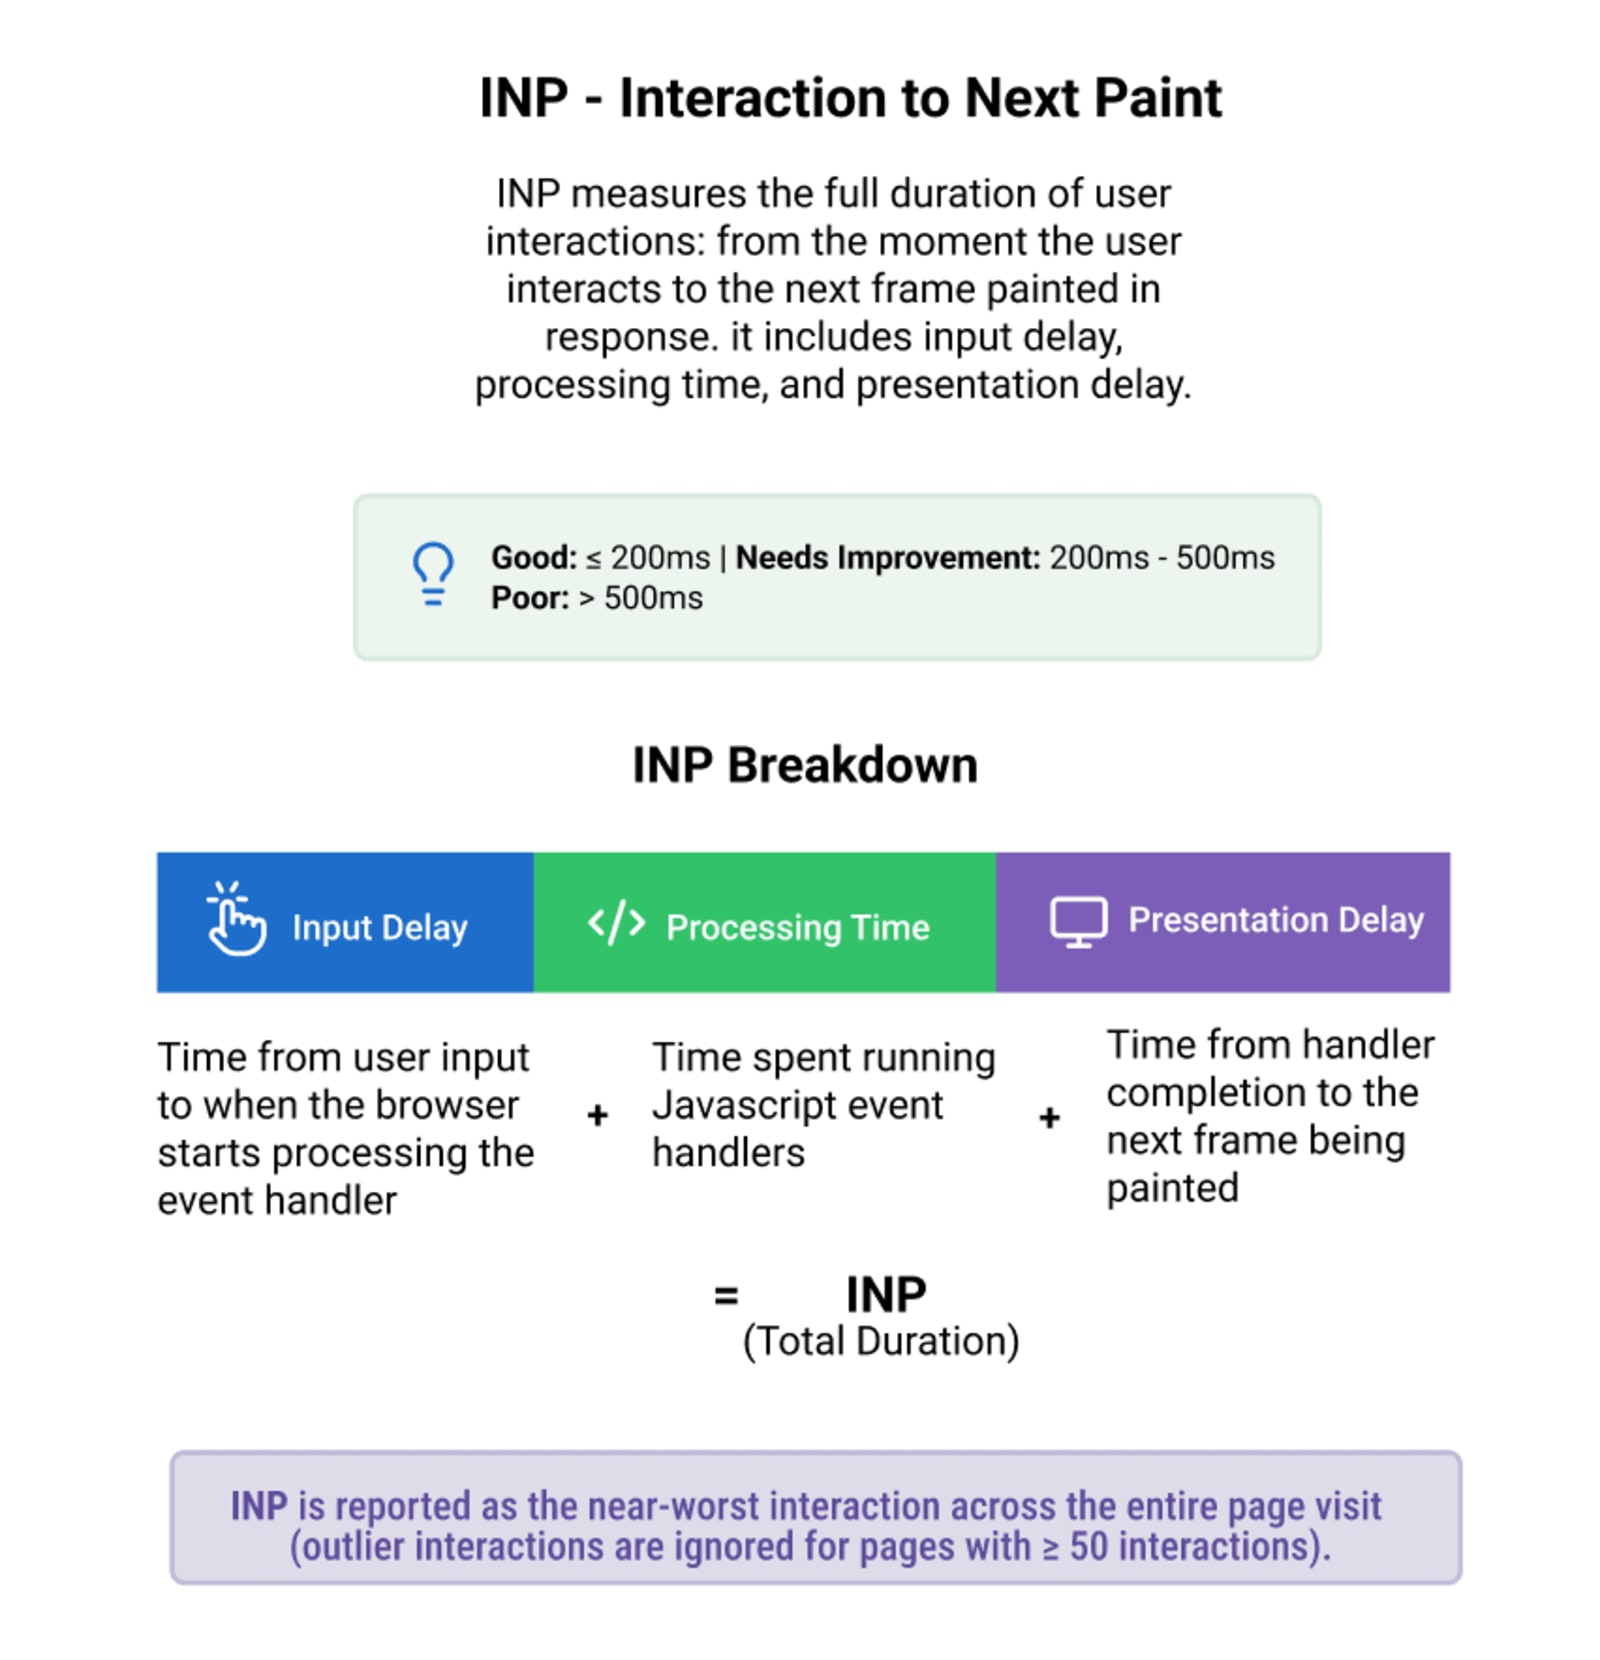
Specifically, INP captures:
Input delay — time between user input and when the browser begins processing the event handler
Processing time — time spent running JavaScript event handlers
Presentation delay — time between the event handler completing and the browser actually rendering and compositing the next frame
To fully understand why rendering and compositing delays impact INP, it helps to understand how browsers internally handle parsing, layout, paint, and compositing. This guide on how browsers work internally breaks down the rendering pipeline behind modern web performance metrics.
All three are summed to get the interaction duration. INP is reported as the worst interaction across the entire page visit — with one caveat.
The Percentile Caveat
For pages with fewer than 50 interactions, INP is literally the worst single interaction. For pages with 50 or more interactions, the worst few are excluded (specifically, at most 1 per 50 interactions is ignored) to prevent outlier taps from dominating the score.
This is a deliberate design choice: Google wants INP to reflect typical behavior, not a single accidental double-tap or a tab that was backgrounded for 10 minutes.
Interaction Types That Count
Not all events are considered. INP only counts:
Click events (mouse and touch)
Key events (keydown, keypress, keyup)
Pointer events
Scroll is explicitly excluded. This is intentional — scroll performance is considered a separate concern tracked by other metrics.
What Causes Poor INP
Long JavaScript tasks blocking the main thread when a user interacts
Heavy event handlers that synchronously read layout (
offsetHeight,getBoundingClientRect) and trigger forced reflows
Modern rendering systems like Pretext JS specifically target reflow-heavy rendering patterns that can severely impact INP and runtime responsiveness.Third-party scripts (analytics, chat widgets, A/B testing libraries) that execute during interaction handling
React or other framework re-renders that are unnecessarily large in scope — updating 500 nodes when 5 changed
Scoring Thresholds
Score | INP |
|---|---|
Good | ≤ 200ms |
Needs Improvement | 200ms – 500ms |
Poor | > 500ms |
Lab Data vs Field Data: The Most Important Distinction
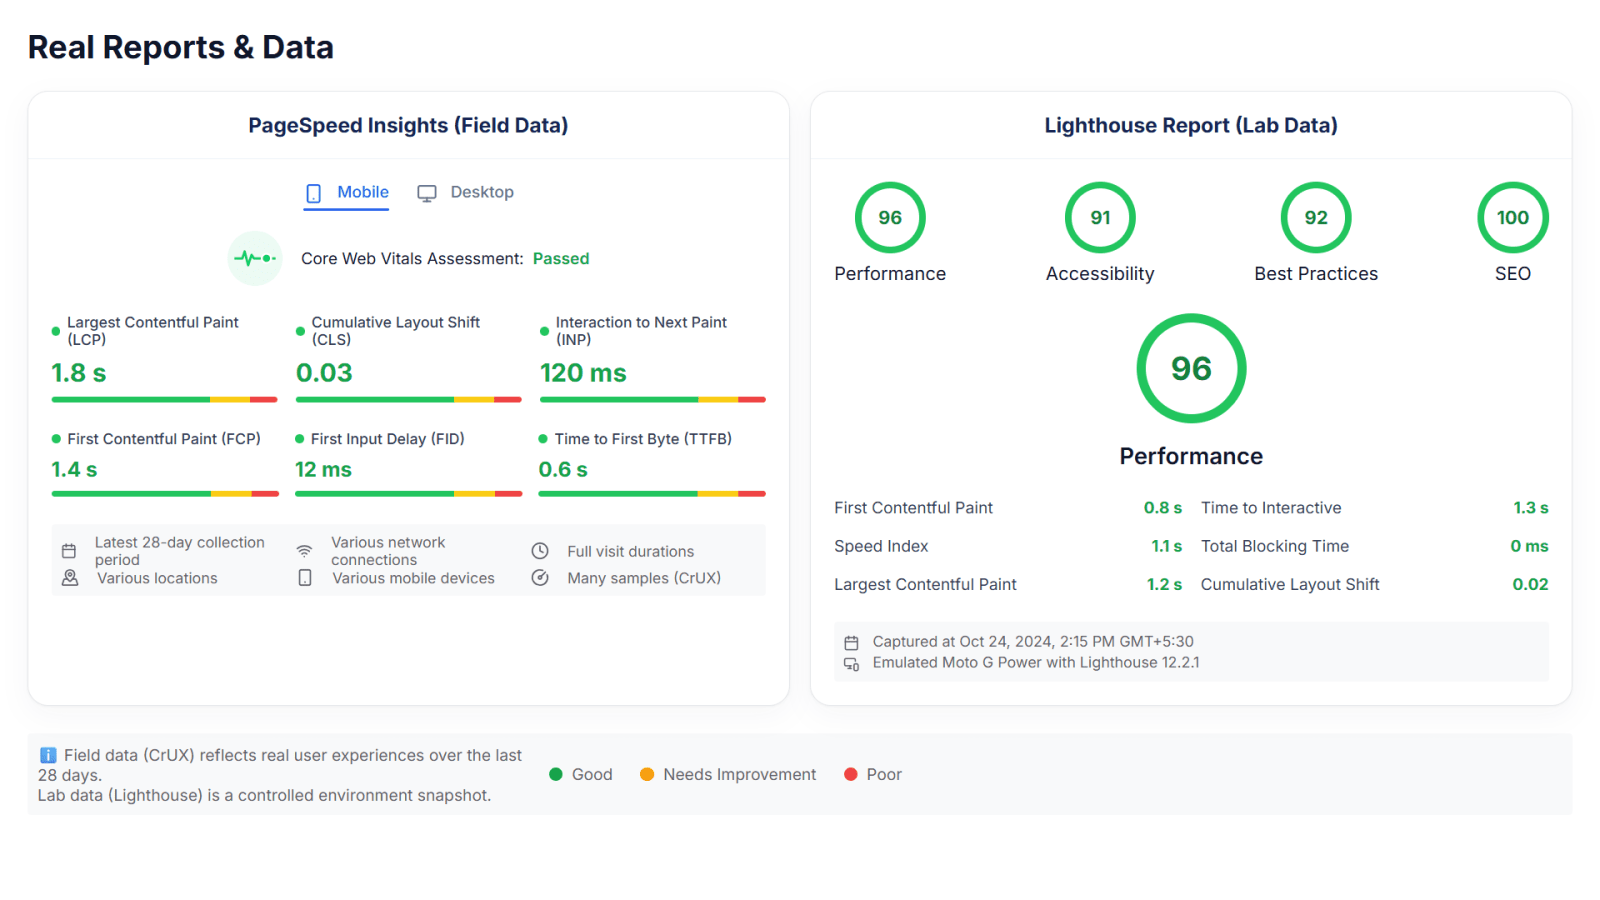
This is where many developers get confused. Tools like Lighthouse and WebPageTest run in a controlled environment — they load your page once, simulate a device and network condition, and report a score. This is lab data.
Field data is collected from real users visiting your page in the wild, captured by the Chrome browser and aggregated in the CrUX dataset. This is what PageSpeed Insights shows under "Discover what your real users are experiencing."
The critical truth: Google's ranking signals use field data, not lab data.
You can have a perfect Lighthouse score and still have a "Poor" PageSpeed rating if real users on slow connections in different geographies are having a different experience. Lab data is a development tool — indispensable for iteration and debugging. But field data is the ground truth.
For LCP and CLS, both lab and field data are generally reliable. INP, however, cannot be measured in lab conditions at all — it requires actual user interactions, which synthetic tools can't replicate. To measure INP in the field, you need a Real User Monitoring (RUM) setup using the web-vitals JavaScript library or a third-party RUM provider.
How to Actually Observe These Metrics
Before touching any optimization, set up proper observation:
In the browser: The web-vitals npm package (npm install web-vitals) exposes onLCP, onCLS, and onINP callbacks. Log these to your analytics or console during development.
In Chrome DevTools: The Performance panel's timeline shows LCP markers and layout shift regions. The rendering tab has "Layout Shift Regions" highlighting. The Interactions track in the timeline shows INP candidates directly.
In PageSpeed Insights: Always check both the "Field Data" section (CrUX, 28-day rolling window) and the "Lab Data" section (single Lighthouse run). If they diverge significantly, you have a real-world condition your lab tests aren't capturing.
In Search Console: The Core Web Vitals report groups your URLs by "Good", "Needs Improvement", and "Poor" based on actual user data. This is the highest-signal starting point — it tells you which page types have problems, not just which individual URL you happened to test.
Bringing It Together
LCP, CLS, and INP are not arbitrary numbers. They each model a specific dimension of user experience — loading perception, visual stability, and interaction responsiveness — and they each have precise measurement models that define what counts, when, and how much.
LCP is the final candidate in a continuous race; it's locked when the user first interacts. CLS is the worst session window of weighted layout shifts. INP is the near-worst full-duration interaction across the entire visit.
Once you understand what you're measuring, the optimization path becomes obvious rather than guesswork. You'll know why compressing a background image might not help your LCP. You'll know why your CLS only appears in field data and not Lighthouse. You'll know why a fast event handler can still produce a poor INP.
Measure precisely. Then optimize deliberately.
This post is part of the NoteHub series on frontend system design.