DB Scan Clustering

DBSCAN Clustering in ML (Density-Based Clustering)
Clustering analysis, or simply clustering, is an unsupervised learning technique that divides data points into a number of groups or "clusters." The idea is that points in the same cluster share similar characteristics, while points in different clusters differ in some meaningful way. There are many clustering methods based on various principles, including density, distance, and evolution strategies.
Fundamentally, all clustering methods follow a common approach:
First, calculate similarities between data points.
Then, group them based on those similarities.
Here, we’ll focus on Density-Based Spatial Clustering of Applications with Noise (DBSCAN).
What is DBSCAN?
Clusters, in DBSCAN, are defined as dense regions in the data space, separated by areas of lower density. The DBSCAN algorithm works on the intuitive idea that:
A point belongs to a cluster if it has enough neighboring points (within a certain radius).
This means that for each point in a cluster, the neighborhood around it (within a given radius ε) must contain at least a minimum number of points (MinPts).
Why DBSCAN?
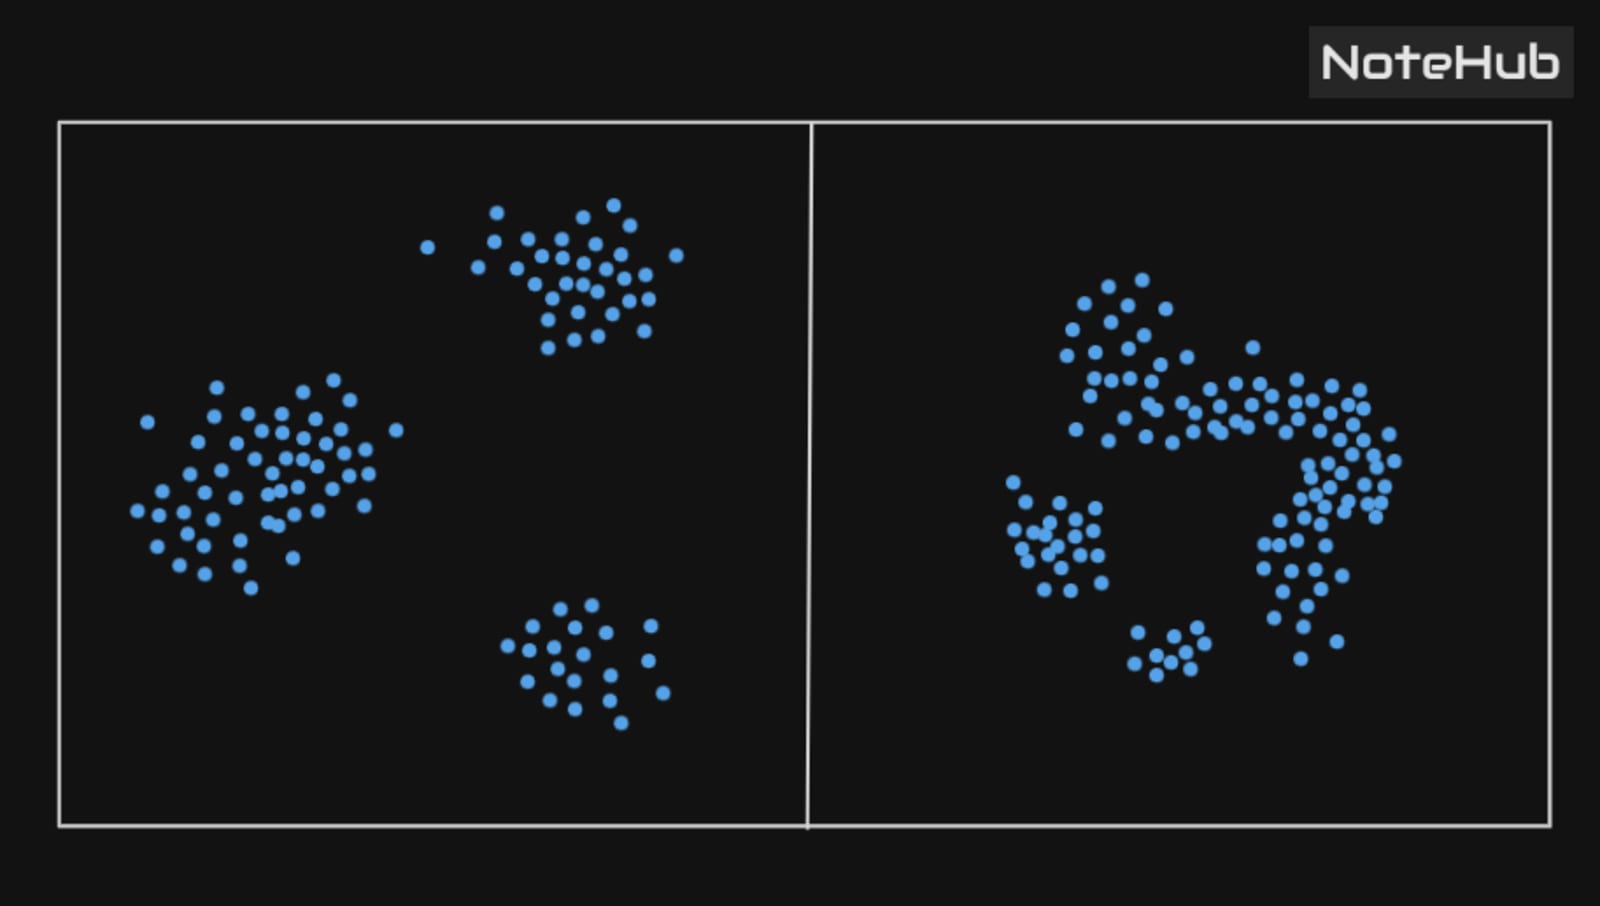
Most traditional clustering algorithms like K-Means or Hierarchical Clustering assume that clusters are:
Spherical or convex in shape.
Well-separated from each other.
But in real-world scenarios, data is often messy:
Clusters may have arbitrary shapes, like spirals or blobs.
Noise and outliers are usually present and can mess up other clustering techniques.
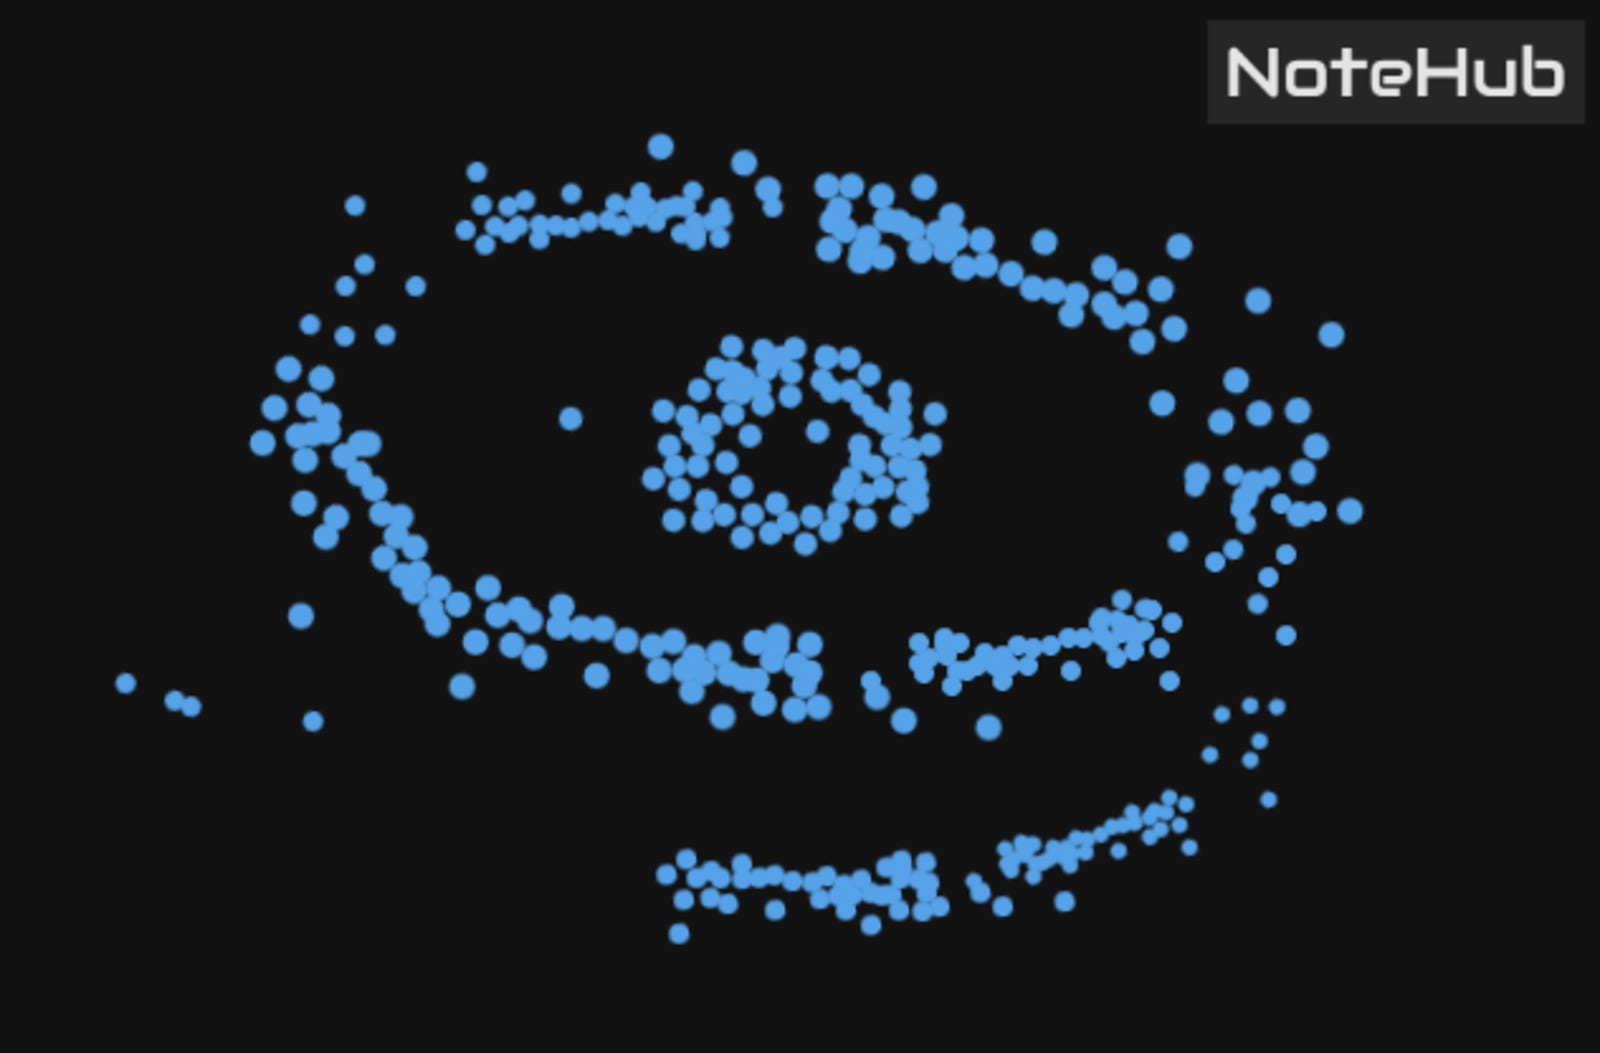
The figure below shows a dataset containing non-convex clusters and outliers/noise. Given such data, the K-means algorithm has difficulties identifying these clusters with arbitrary shapes.
DBSCAN Algorithm Requires Two Parameters:
eps: It defines the neighborhood around a data point, i.e., if the distance between two points is lower than or equal to 'eps', then they are considered as neighbors.
If the eps value is chosen too small, then a large part of the data will be considered as outliers.
If it is chosen too large, then the clusters will merge, and the majority of the points will be in the same cluster.
One way to find the eps value is based on the K-distance graph.MinPts: Minimum number of neighbors (data points) within eps radius.
The larger the dataset, the larger value of MinPts must be chosen.
As a general rule, the minimum MinPts can be derived from the number of dimensionsDin the dataset as:
MinPts ≥ D + 1
The minimum value of MinPts must be at least 3.
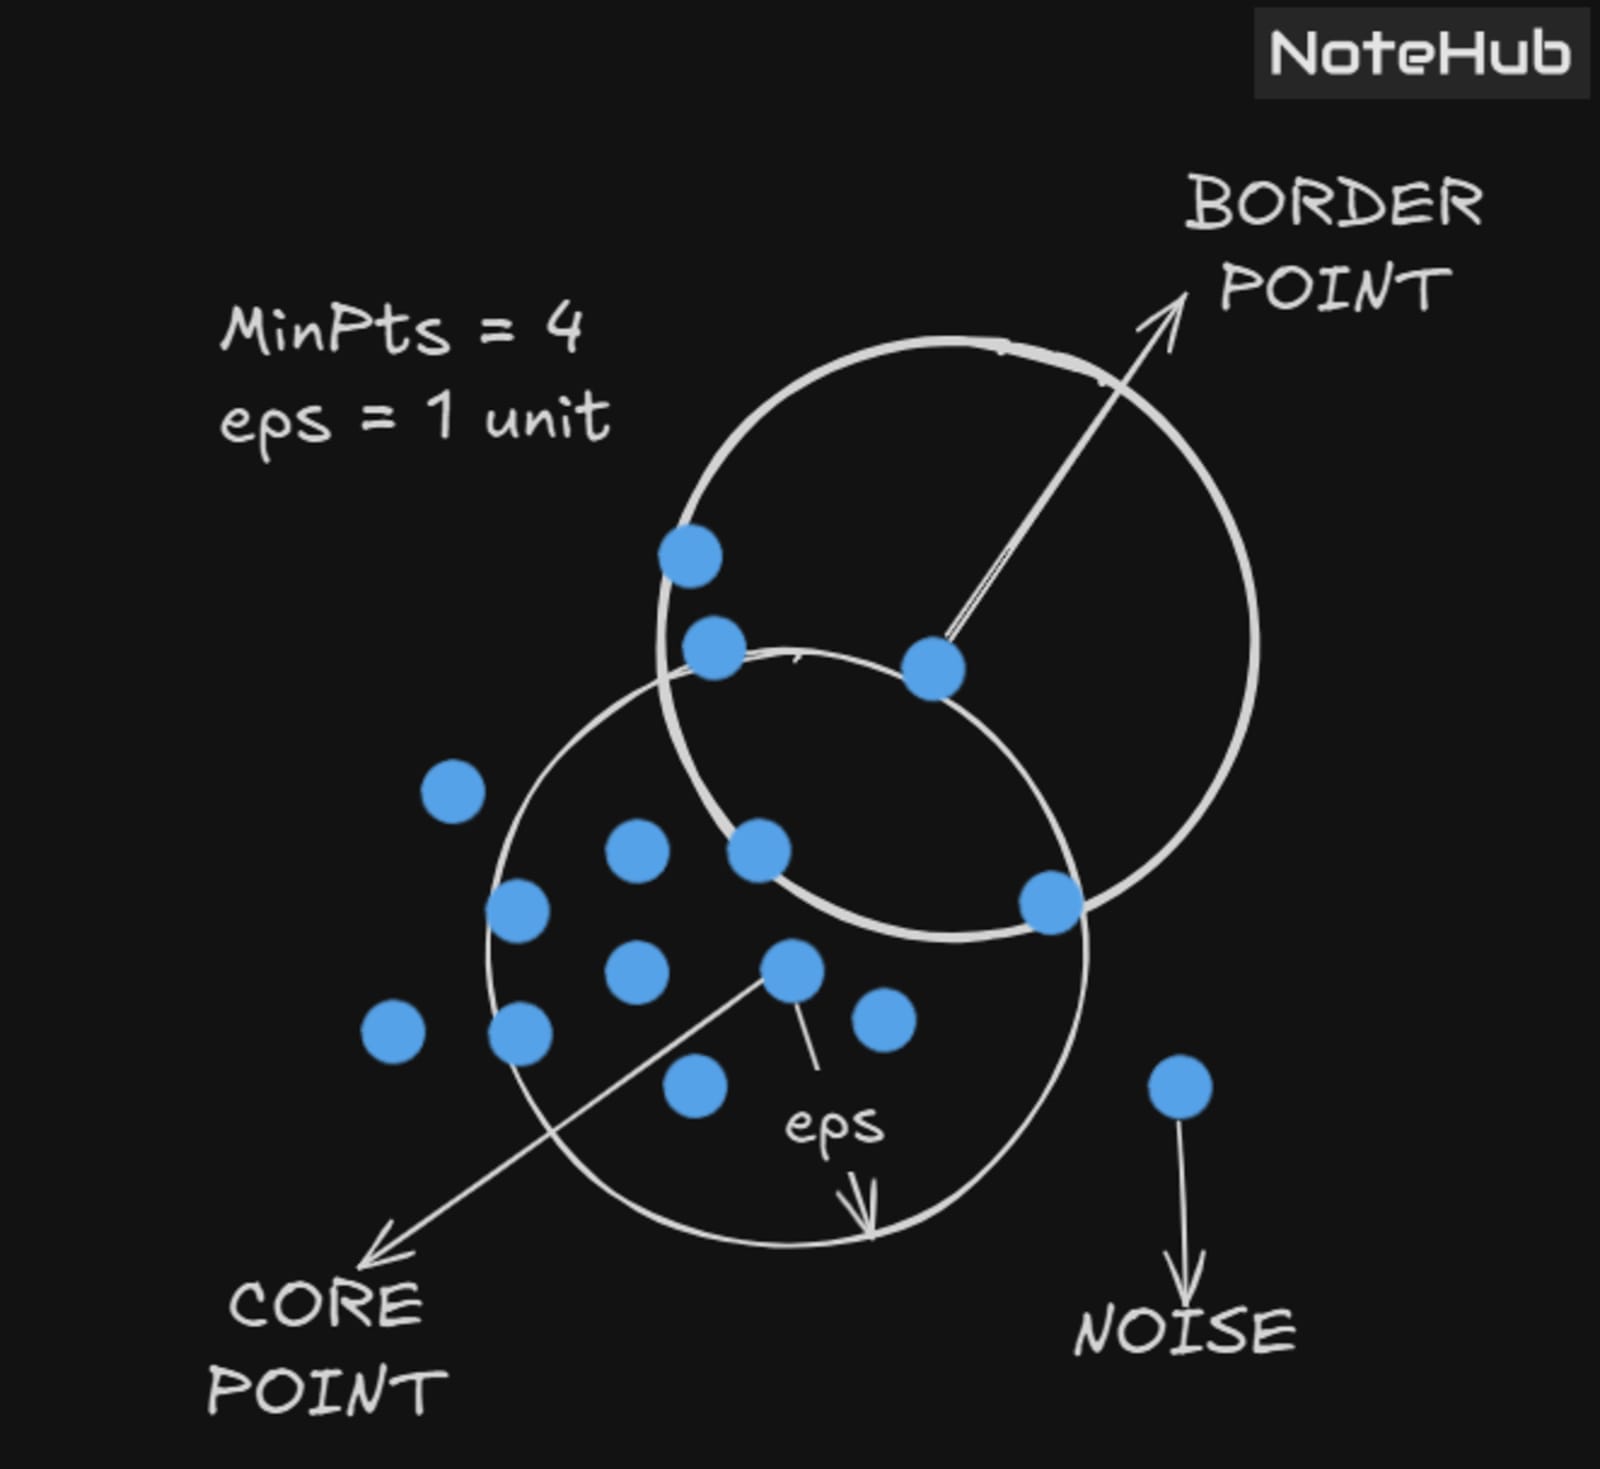
In this algorithm, we have 3 types of data points:
Core Point: A point is a core point if it has greater than or equal to MinPts points within eps.
Border Point: A point which has fewer than MinPts within eps but is in the neighborhood of a core point.
Noise or Outlier: A point which is neither a core point nor a border point.
DBSCAN Algorithm Can Be Abstracted into the Following Steps:
Find the neighbor points within eps and identify the core points (those with more than MinPts neighbors).
For each core point, if it is not already assigned to a cluster, create a new cluster.
Recursively find all its density-connected points and assign them to the same cluster as the core point.
Two pointsaandbare said to be density connected if there exists a pointcwhich has a sufficient number of points in its neighborhood, and both pointsaandbare within the eps distance.
This is a chaining process, so ifbis a neighbor ofc,cis a neighbor ofd,dis a neighbor ofe, andeis a neighbor ofa, then it implies thatbis a neighbor ofa.Iterate through the remaining unvisited points in the dataset. Those points that do not belong to any cluster are considered noise.
Disadvantages of K-Means:
K-Means forms spherical clusters only. This algorithm fails when data is not spherical (i.e., doesn't have the same variance in all directions).
K-Means algorithm is sensitive to outliers. Outliers can skew the clusters in K-Means to a very large extent.
Basically, DBSCAN algorithm overcomes all the above-mentioned drawbacks of the K-Means algorithm.
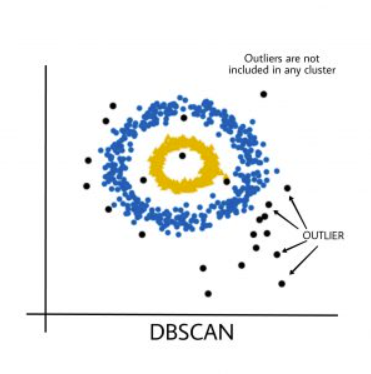
DBSCAN identifies dense regions by grouping together data points that are close to each other based on distance measurement.
✅ Use DBSCAN Over K-Means When:
Clusters are of arbitrary/non-convex shape
K-Means only works well for circular/spherical clusters.Data has noise or outliers
DBSCAN can easily detect and ignore outliers, unlike K-Means.You don’t know the number of clusters in advance
K-Means needs you to specifyk, but DBSCAN figures out clusters based on density.Cluster sizes and densities vary
DBSCAN can handle varying densities (to an extent); K-Means struggles with this.
❌ Avoid DBSCAN When:
You have high-dimensional data, as distance-based density becomes less meaningful (curse of dimensionality).
Choosing the right
epsandMinPtsis difficult—it requires tuning.